Here’s something weird: every U.S. President that has worn a full beard was born in Ohio. Or…is that weird? What are the odds of that?
Defining a beard
You may be thinking “What about Lincoln?”. “He did not have a full beard,” I think in response. A whaler, certainly. A Shenandoah, arguably. But his upper lip is bare. Beard experts agree, “a full beard consists of hair on the upper and lower lip, the chin, the cheeks, and the sideburns, without any natural or shaven gap.” 1
So who had full beards? The Wikipedia article List of presidents of the United States with facial hair cites these four men:
- Ulysses S. Grant (#18, 1869–1877)
- Rutherford B. Hayes (#19, 1877–1881)
- James A. Garfield (#20, 1881)
- Benjamin Harrison (#23, 1889–1893)
All born in Ohio.
Population
Could this just be a coincidence due to the population distribution? If we assume that a beard during those presidencies was inevitable, we can calculate the odds of each of those presidents having been born in Ohio. Realistically, any president elected in the 19th century would have been a white man, so for a rough estimate we can look at the proportion of whites born in the US around the time of the elections. Fortunately the census gathers this information, and based on the 1870 data2 the odds are about 1 in 13,000 for all four of the men being born in Ohio.
math
Miraculous! But of course if they’d all been born in New York or Pennsylvania we’d be asking essentially the same question3. The odds of all four being born in the same state, whichever state that is, are about 1 in 1,400.
math
Each state’s share p of white native-born Americans, raised to the fourth power (the chance all four were born there), then summed over every state and territory. The table shows the states with more than 100,000; the rest add almost nothing.
| State | Whites born there | p | p⁴ |
|---|---|---|---|
| New York | 4,016,326 | 0.142952 | 0.0004175981 |
| Pennsylvania | 3,351,722 | 0.119297 | 0.0002025418 |
| Ohio | 2,615,264 | 0.093084 | 0.0000750766 |
| Illinois | 1,469,524 | 0.052304 | 0.0000074843 |
| Virginia and West Virginia | 1,380,568 | 0.049138 | 0.0000058301 |
| Indiana | 1,350,938 | 0.048084 | 0.0000053455 |
| Kentucky | 1,211,888 | 0.043134 | 0.0000034617 |
| Massachusetts | 1,138,492 | 0.040522 | 0.0000026963 |
| Tennessee | 1,106,318 | 0.039377 | 0.0000024042 |
| Missouri | 936,564 | 0.033335 | 0.0000012348 |
| North Carolina | 866,446 | 0.030839 | 0.0000009045 |
| Georgia | 719,124 | 0.025596 | 0.0000004292 |
| Maine | 698,483 | 0.024861 | 0.0000003820 |
| New Jersey | 697,821 | 0.024837 | 0.0000003806 |
| Maryland | 593,513 | 0.021125 | 0.0000001991 |
| Michigan | 563,790 | 0.020067 | 0.0000001621 |
| Wisconsin | 545,289 | 0.019408 | 0.0000001419 |
| Alabama | 522,306 | 0.018590 | 0.0000001194 |
| Iowa | 515,896 | 0.018362 | 0.0000001137 |
| Connecticut | 479,391 | 0.017063 | 0.0000000848 |
| Vermont | 420,023 | 0.014950 | 0.0000000499 |
| South Carolina | 418,875 | 0.014909 | 0.0000000494 |
| New Hampshire | 366,778 | 0.013055 | 0.0000000290 |
| Mississippi | 325,319 | 0.011579 | 0.0000000180 |
| Louisiana | 277,133 | 0.009864 | 0.0000000095 |
| Texas | 273,903 | 0.009749 | 0.0000000090 |
| Arkansas | 212,973 | 0.007580 | 0.0000000033 |
| California | 173,792 | 0.006186 | 0.0000000015 |
| Rhode Island | 167,459 | 0.005960 | 0.0000000013 |
| Minnesota | 137,899 | 0.004908 | 0.0000000006 |
| Delaware | 106,581 | 0.003794 | 0.0000000002 |
Still very surprising! But we held beards constant. What if we hold the presidents constant? That is, assuming that Grant, Hayes, etc. were elected, what were the odds those are the men who would have beards? Was this just a case of fashion producing beards at the right time? Let’s look at beard probabilities.
Beard probabilities
I had Claude do a visual tally of every congressional member between 1789 and 2026 for which it could find photos4. Using this as the base rate of a bearded president, we can calculate the odds of having at least 3 presidents wearing beards and being from the same state (if there were anything less than 3 the fact wouldn’t be very interesting).
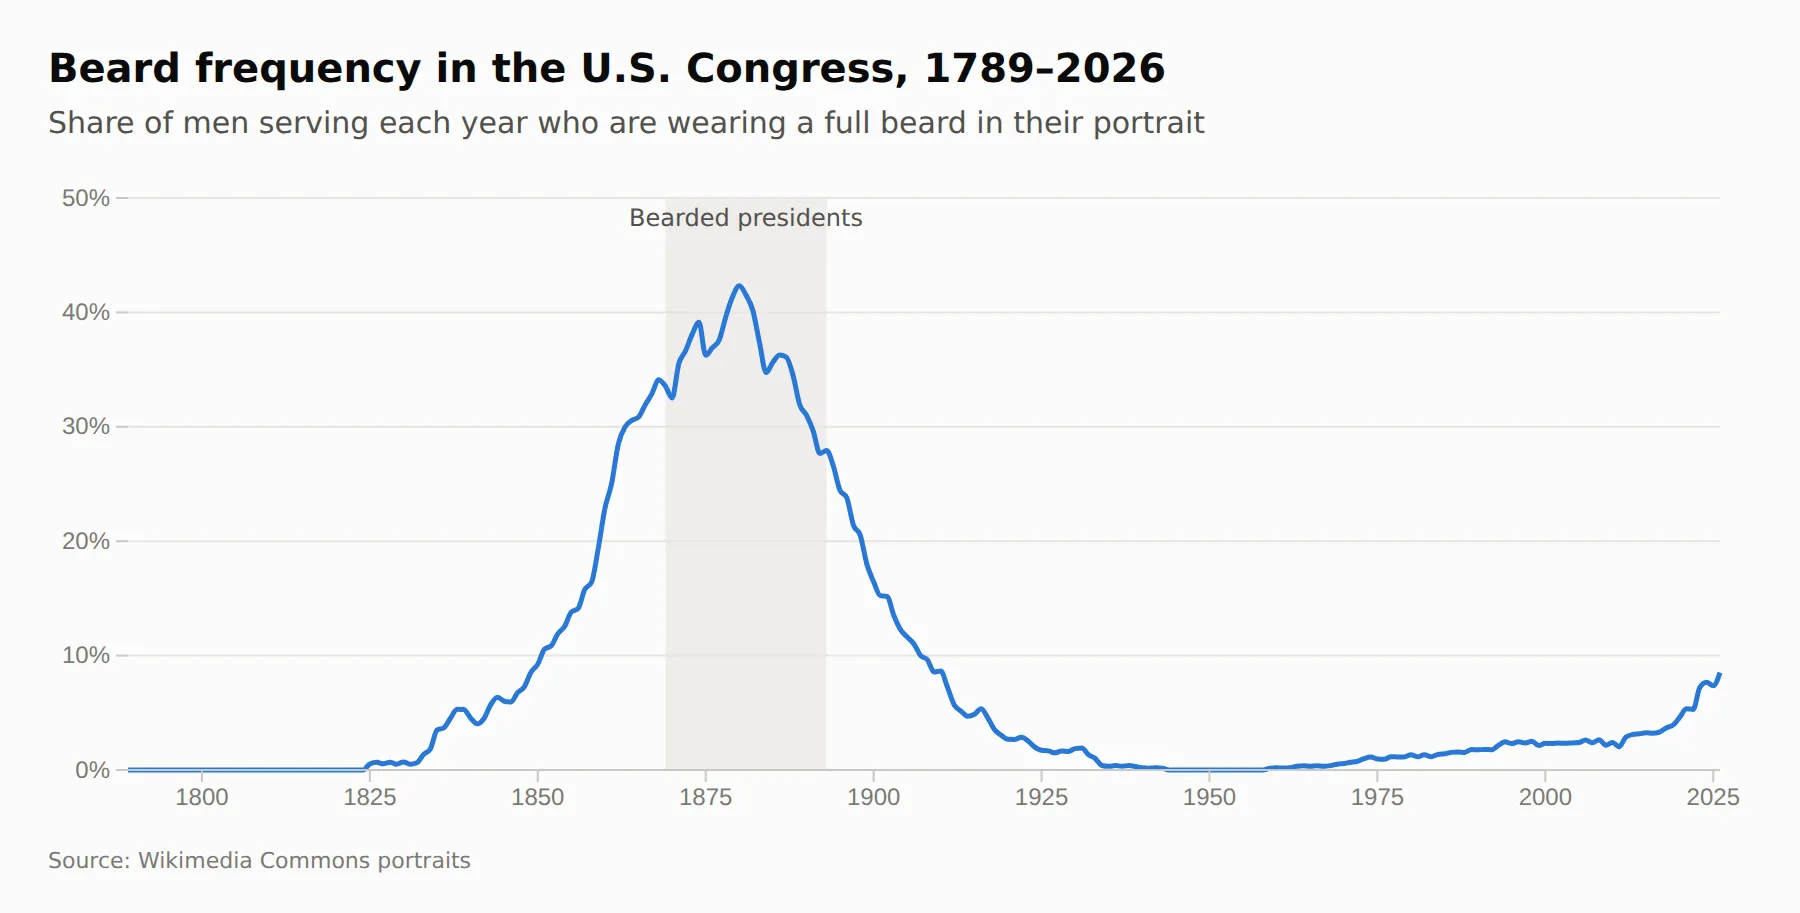
Beards were very unpopular (and thus unlikely) for much of history, so if we focus on just the 19 presidents from 1849 to 1929, Ohio happens to be the only state with at least 3. The probability of there being at least 3 beards, all among Ohioans, is then about 1 in 45.
math
Each president’s chance p of a full beard is the share of men in Congress with one in the year he took office. The presidents from 1849 to 1929 with a chance above 5%:
| Took office | President | Born in | p |
|---|---|---|---|
| 1849 | Zachary Taylor | VA | 9% |
| 1850 | Millard Fillmore | NY | 9% |
| 1853 | Franklin Pierce | NH | 12% |
| 1857 | James Buchanan | PA | 16% |
| 1861 | Abraham Lincoln | KY | 25% |
| 1865 | Andrew Johnson | NC | 31% |
| 1869 | Ulysses S. Grant | OH | 34% |
| 1877 | Rutherford B. Hayes | OH | 38% |
| 1881 | James A. Garfield | OH | 42% |
| 1881 | Chester A. Arthur | VT | 42% |
| 1885 | Grover Cleveland | NJ | 36% |
| 1889 | Benjamin Harrison | OH | 32% |
| 1897 | William McKinley | OH | 21% |
| 1901 | Theodore Roosevelt | NY | 15% |
| 1909 | William Howard Taft | OH | 9% |
Multiplying (1 − p) over the 12 non-Ohioans gives 0.093. The chance that at least 3 of the 7 Ohioans (Grant, Hayes, Garfield, Harrison, McKinley, Taft and Harding) have beards is 0.243. So:
Only Ohio had 3 or more presidents in this span, so “Ohio” and “any one state” are the same thing here.
The expected number of beards is 3.8, so the 4 that history gave us is unsurprising.
math
The expected number of bearded presidents is the sum of every president’s chance:
So if we assume the presidents we got, it’s surprising but believable that the Ohioans would have beards (1 in 45). We can go a step further and factor in the generation they were born in, since men tended to keep the style they adopted when young.
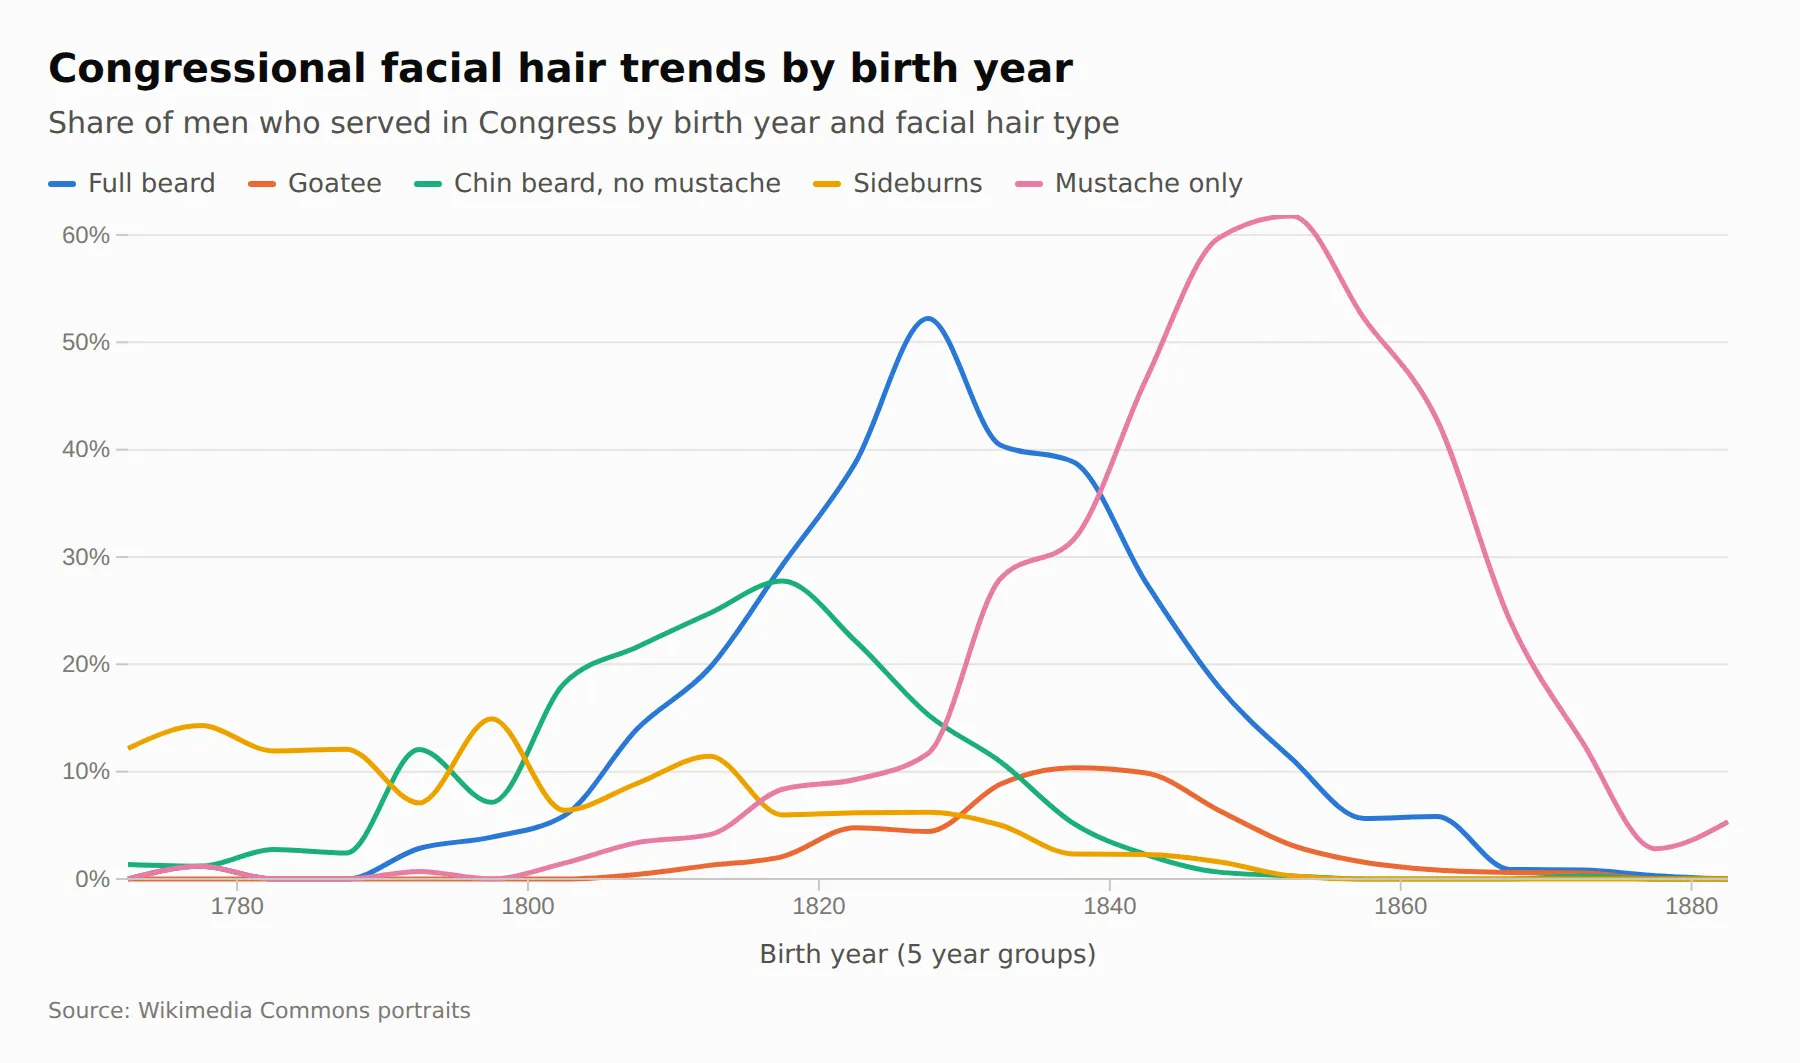
Giving each president the beard rate of congressmen born within five years of him and serving around his inauguration brings the odds to 1 in 18.
math
Among men serving in Congress from 1865 to 1889, by decade of birth:
| Born in the | Full beard |
|---|---|
| 1800s | 17% |
| 1810s | 32% |
| 1820s | 47% |
| 1830s | 39% |
| 1840s | 26% |
| 1850s | 10% |
| President | Born | p by year | p by year and generation |
|---|---|---|---|
| Lincoln | 1809 | 25% | 15% |
| A. Johnson | 1808 | 31% | 18% |
| Grant | 1822 | 34% | 42% |
| Hayes | 1822 | 38% | 40% |
| Garfield | 1831 | 42% | 45% |
| Arthur | 1829 | 42% | 44% |
| Cleveland | 1837 | 36% | 42% |
| Harrison | 1833 | 32% | 42% |
| McKinley | 1843 | 21% | 26% |
Here each president’s p is the full-beard share of men in Congress born within 5 years of him and serving within 4 years of his inauguration.
Only mildly surprising! But perhaps we can suck even more fun out of it.
We learned that it’s much more surprising that, given the beards, they’d all be on faces from the same state (1 in 1,400). But perhaps there’s a confounder for both the state and the beard.
Confounders
Other than the beards the presidents have a lot in common:
1. Same generation
All four were born within 11 years of each other and took office in the late 19th century. This is mostly captured by the generation analysis above.
2. Same party (Republicans)
Beards weren’t much more popular among Republicans (30% of Republicans vs. 27% of Democrats in Congress from 1856 to 1896, p = 0.17) but were somewhat more common among Ohio Republicans specifically (46% of Ohio Republicans vs. 31% of other Republicans from 1866 to 1896, p = 0.04).
3. Last names starting with “H” or “G”
Could nominative determinism play a role? “Harrison” is close to “hairy son” and he was the grandson of William Henry Harrison, but let’s save that for if we get desperate.
4. Union generals
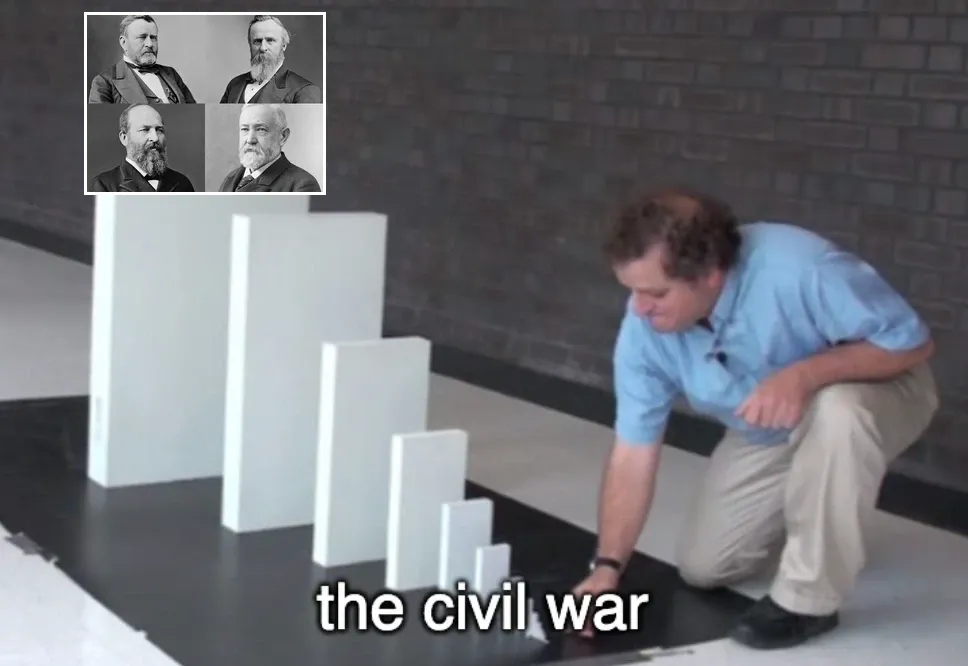
All four commanded Union troops in the Civil War and ended it as generals5. A Union general was the Republican nominee in 6 of 7 elections from 1868 to 1892, and generals won 5 of those 7. Among Union generals beards were much more common: 49% of the 596 Union generals had full beards, compared with 27% of congressmen serving in the same years (1861–1869). It doesn’t seem downstream of age differences; compared with congressmen born in the same years, 50% of generals had full beards vs 35% of non-generals.
math
| Born in the | Union generals | Congressmen (1857–1873) |
|---|---|---|
| 1800s | 47% (of 43) | 12% (of 186) |
| 1810s | 54% (of 151) | 22% (of 473) |
| 1820s | 61% (of 234) | 45% (of 449) |
| 1830s | 31% (of 123) | 39% (of 175) |
Adjusting for birth decade, generals had 2.1 times the odds of a full beard (Mantel–Haenszel odds ratio, p ≈ 2 × 10⁻¹³).
If we factor in their general status, the odds now become about 1 in 10.
math
Raise each general’s odds of a beard by the age-adjusted odds ratio of 2.1:
Grant goes from 42% to 61%, Hayes from 40% to 59%, Garfield from 45% to 63% and Harrison from 42% to 61%. Nobody else changes, so the non-Ohio factor stays 0.169 and the Ohio factor rises to 0.599:
The remaining coincidence is mostly that Arthur (44%) and Cleveland (42%) happened not to grow full beards.
Putting it all together, it seems like the coincidence is on the order of 1 in 10.
| Step | Odds |
|---|---|
| Ohio’s share of the population | 1 in 13,000 |
| …widened to any state | 1 in 1,400 |
| Fixing the presidents, adding beard fashion | 1 in 45 |
| …and the generation they were born in | 1 in 18 |
| …and the fact that they were Union generals | 1 in 10 |
Why Ohio Generals?
Hayes, Garfield, and Harrison were dark-horse picks, chosen as a compromise after repeated deadlocks during nomination. Hayes and Harrison lost the popular vote, and Garfield won the popular vote by the slimmest margin in history (fewer than 2,000 votes out of 9 million). But they were inoffensive (to Republicans) and appealing to Union veterans, which made them easy compromise picks, and each eked out a victory.
Ohio also produced a lot of generals. It had about 9% of the native-born population, but 12.5% of U.S.-born generals. It also produced and then exported a lot of politicians. From 1861 to 1901, almost half of the Ohio-born men in Congress represented other states (136 for other states vs 140 for Ohio). A quarter of Iowa’s and Kansas’s members were Ohioans, and a fifth of Indiana’s. Fittingly, 2 of the 4 presidents in question built their careers in other states: Grant in Illinois and Harrison in Indiana.
As the most famous general, Grant was an exception and cruised through. Had a few thousand votes gone the other way, he might’ve been the only one left on this list.
So why are the bearded presidents from Ohio?
As best I can tell:
- Beards peaked in popularity and respectability in the late 19th century
- Union generals wore beards far more often than other politicians
- Ohio produced an outsized share of Union generals, and exported its politicians
- Republicans favored generals from Midwestern swing states as compromise nominees
- Those nominees (narrowly) won
Beards are back: 8.5% of the men in Congress in 2026 wear full beards, the highest share since about 1910 (and up from 3% a decade ago). And one particular bearded favorite for the presidency in 2028 happens to have been born in Ohio.
I’m talking of course about myself. After all, Vance doesn’t start with “H” or “G”.
Other interesting facts
- The longest beard drought in Congress was 15 years, from 1944 to 1958. Interestingly, this began during WW2. Shaving standards in the military were strict because of gas mask fits starting with WW1, and being clean shaven became seen as hygienic, modern, and professional. Previously during the Civil War, beards were seen as masculine and natural/Romantic. It seems fashion in Congress may often follow military fashion.
- The modern beard Renaissance is bipartisan; 7% of Republicans and 8% of Democrats in Congress had full beards in 2023–2026.
- Most bearded states as represented in Congress from 1873–1885: California 57%, Alabama 56%, Michigan 50%. Least: Wisconsin 19%, Texas 23%, Kentucky 24%.
- Chamber (senator vs representative vs governor) and region (north vs south) had little effect on beards
Footnotes
-
Source: https://www2.census.gov/library/publications/decennial/1870/population/1870a-32.pdf. This assumes the gender split is approximately equal across states. ↩︎
-
This is the Texas sharpshooter fallacy ↩︎
-
Note on the methodology: The sample was every member of Congress (and every governor) with a portrait on Wikimedia Commons. This totaled 10,241 men in Congress, covering about 95% of members from the 1860s on and 50–70% before 1849. Women are excluded since they are unlikely to have a beard. To try to limit measurement bias, each portrait was cropped to the face and shuffled onto numbered contact sheets with no name, year, party or state. The categories were predefined (full beard, goatee, chin beard without a mustache, sideburns, mustache only, clean-shaven). Small faces, crops that missed the face, and borderline calls were flagged and re-coded from the uncropped image. Two independent passes over the same 709 portraits agreed on 96% of full-beard calls (Cohen’s κ = 0.87). Later, 200 portraits re-coded in a different batch matched their first codes 95% of the time on full beard or not. The Union generals mentioned later in the post were mixed onto the same contact sheets as 200 congressmen from the same years, so both groups were judged together. (Uniforms were still visible.)
As an external check, in 1908 the Los Angeles Times counted 10 beards in 103 published pictures of congressmen (about 10%). The census gives 10% full beards (13% with any beard) for members serving that year. The portraits however were not always from the year the person served, and so may not be representative of their facial hair status during their term.
The data and code used in analysis are available at https://github.com/michaelgriscom/congress-beard-census ↩︎
-
This is generous to Harrison, who obtained a mostly honorary title of brevet brigadier general ↩︎